React Native Package
hakka-react-native is the app-facing package for React Native. It provides a TypeScript API, a TurboModule bridge to the native Hakka SDKs, JS-layer fallback capture, optional monitors, and optional inspector UI.
Beta Fully working and on npm. It has less production soak time than the web and Next.js SDKs.
What Hakka captures
Section titled “What Hakka captures”| Traffic type | Captured | Notes |
|---|---|---|
fetch |
Auto | JS-layer interception |
XHR |
Auto | JS-layer interception |
| WebSocket frames | Auto | JS monkey-patch; auto mode keeps this even when native handles HTTP |
| Native HTTP (URLSession / OkHttp) | Auto | Via TurboModule in native or auto mode |
| Native WebSocket metadata | Opt-in | Message count + close code only; payloads require JS layer |
| GraphQL operation name | Auto | Parsed from request body |
-
Install the package and clipboard peer
Terminal npm install hakka-react-native @react-native-clipboard/clipboardTerminal pnpm add hakka-react-native @react-native-clipboard/clipboardTerminal yarn add hakka-react-native @react-native-clipboard/clipboardTerminal bun add hakka-react-native @react-native-clipboard/clipboardThen run native install:
Terminal cd ios && pod install -
Start capture
Call
Hakka.startonce, before any network traffic — top of your entry file works well.index.ts import { Hakka } from 'hakka-react-native'Hakka.start({mode: 'auto', // prefers native; JS fallback when native is absentmaxRequests: 500,maxBodySize: 256 * 1024,})mode: 'auto'is the right default. See Capture Modes for the full option set. -
Add the inspector UI (optional but recommended for development)
First install the UI peers:
Terminal npm install react-native-gesture-handler react-native-reanimated react-native-safe-area-context react-native-svg react-native-workletsTerminal pnpm add react-native-gesture-handler react-native-reanimated react-native-safe-area-context react-native-svg react-native-workletsTerminal yarn add react-native-gesture-handler react-native-reanimated react-native-safe-area-context react-native-svg react-native-workletsTerminal bun add react-native-gesture-handler react-native-reanimated react-native-safe-area-context react-native-svg react-native-workletsThen wrap your app root:
App.tsx import { HakkaInspector } from 'hakka-react-native/ui'export function App() {return (<HakkaInspector.Wrapper mode="bubble"><YourApp /></HakkaInspector.Wrapper>)}The UI peer graph is entirely optional. The core capture API works without it.
-
Verify it works
Trigger any network call in your app (an API fetch, an image load, anything). Then open the inspector — long-press the bubble overlay or shake the device (a tap just expands a quick summary in place). The request should appear with method, URL, status, and timing.
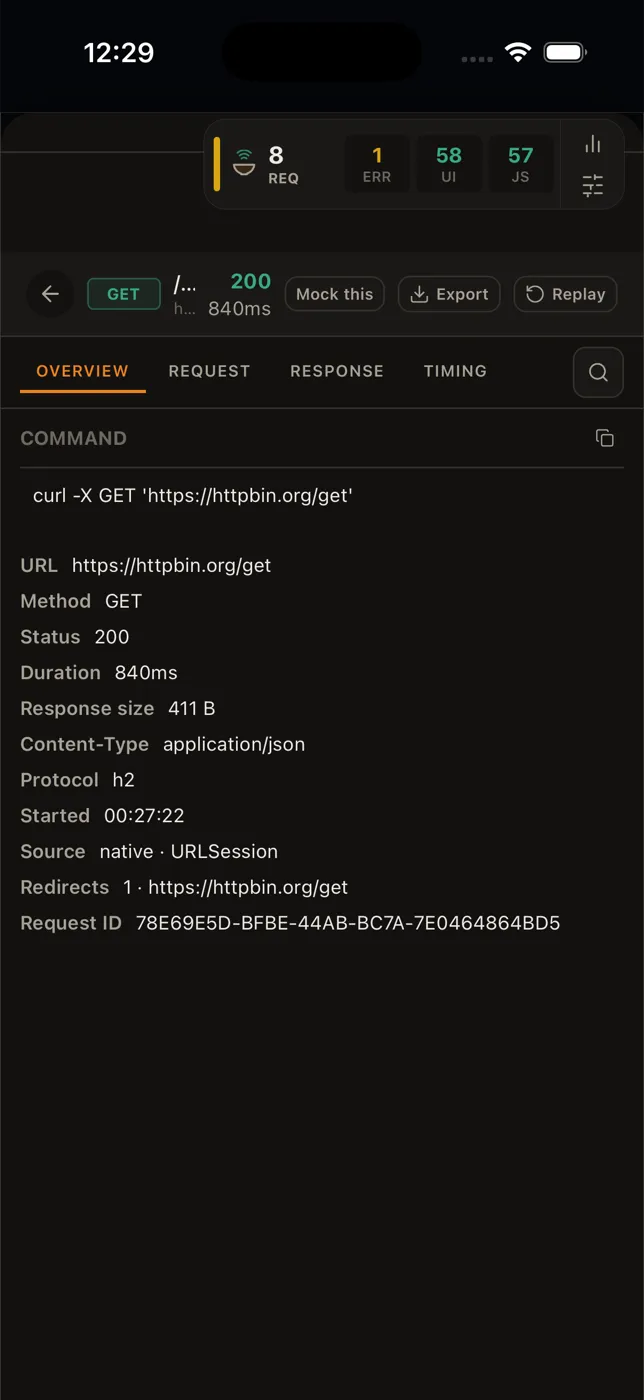
Hakka.start options
Section titled “Hakka.start options”| Option | Type | Default | Description |
|---|---|---|---|
mode |
'auto' | 'native' | 'js' | 'disabled' |
'auto' |
Capture mode. auto prefers native, falls back to JS. |
maxRequests |
number |
500 |
Maximum requests kept in the in-memory store. Oldest are evicted. |
maxBodySize |
number |
262144 |
Maximum body size to capture per request/response, in bytes. |
Inspector UI
Section titled “Inspector UI”<HakkaInspector.Wrapper> defaults to theme="dark", not "system" — a bare
system default would follow the device’s light/dark setting, which frequently
disagrees with a host app’s own (often hardcoded-dark) visual theme and opens the
inspector in a jarring light/cream theme inside a dark app. Pass theme="system"
explicitly to opt back into following the device setting, or theme="light" to
force light:
<HakkaInspector.Wrapper mode="bubble" theme="system"> <YourApp /></HakkaInspector.Wrapper>Other inspector details:
- The header tab strip has five destinations: Network, Stats, Logs, Rules, Storage — the same five, in the same order, as the native iOS and Android inspectors. Console is not a separate tab; it lives inside Logs as a Console/Structured switch.
- The strip is persistent: it stays visible on all five tabs with the current one underlined, and those pages have no back button. Only Settings and the request detail are drill-downs, and only they push a back button.
- The filter bar collapses to search + method chips + a “Filters +n” disclosure, matching the web overlay — status/domain chips and sort/group live behind it, with Select multiple and Reset in its footer.
- Pause capture sits in the filter bar, next to the Filters disclosure — it freezes the list it shares a row with. Clear all lives in Settings, beside session export/import.
- Request-detail search (headers/body) is an icon-only button that expands into a search field in place, rather than a fixed-width “Search” label competing with the detail tabs for space.
- Settings is not a tab. It is reachable from the gear icon in the inspector header and the gear on the floating bubble — so you don’t have to open the full inspector first just to reach it.
- Request rows are 64pt minimum, two-line (method + path, then status + host).
Two ways to render the inspector
Section titled “Two ways to render the inspector”The React Native package gives you a choice of inspector UI, and it is a real architectural fork — not a cosmetic one.
1. The React Native inspector (default). <HakkaInspector.Wrapper> renders
the inspector in JS. It is the most feature-complete surface — session
export/import and the widest copy-as snippet set live here. It pulls in the UI
peer dependencies (Reanimated 4 + Worklets,
@gorhom/bottom-sheet, FlashList) and ships in your JS bundle.
2. The native inspector. Delegate to the SwiftUI (iOS) and Kotlin (Android) inspectors instead, so no JS inspector is bundled at all. Either flip the bubble to native rendering:
<HakkaInspector.Wrapper mode="bubble" bubble={{ renderMode: 'native' }}> <YourApp /></HakkaInspector.Wrapper>or drive the native surfaces imperatively, with no Wrapper at all:
Hakka.show({ as: 'sheet' }) // iOS sheet / Android bottom sheetHakka.show({ as: 'bubble' }) // floating bubbleHakka.show({ as: 'fullscreen' }) // fullscreen inspectorrenderMode is 'js' | 'native' and defaults to 'js' — the same vocabulary
Hakka.start’s mode uses for capture. It only applies in mode="bubble".
Requirements and failure mode. The native path needs the optional native UI
artifacts linked — the HakkaUI product on iOS, com.noodleapps.hakka:hakka-ui
on Android. Hakka.show() returns a boolean: false when the TurboModule
isn’t linked at all, or when it is linked but the native UI package isn’t on
the classpath. Check the return value rather than assuming a surface opened.
Which to pick. Choose native when you want to keep the JS bundle and the Reanimated/bottom-sheet peers out of your app, or when you want one inspector that looks identical to what your native iOS and Android teammates see. Choose the React Native inspector when you want the fullest feature set — the native surfaces are a subset today. Session export/import is React Native only, and the copy-as snippet set is widest there (cURL, HTTPie, OkHttp, URLSession) where each native surface ships cURL plus its own platform snippet. Mock-rule management is no longer a gap: iOS and Android both ship a Mocks screen in their Rules tab.
Optional monitors
Section titled “Optional monitors”import { useQueryMonitor } from 'hakka-react-native/monitors'
function Monitors() { useQueryMonitor([['users']], queryClient) return null}Monitors are add-ons — they annotate captured requests with React Query cache state. Not required for the base capture pipeline.
New Architecture
Section titled “New Architecture”The package prefers TurboModule/codegen lookup when available. JS-layer fallback capture stays active for fetch, XHR, and WebSocket traffic when native capture is unavailable, or when the app explicitly sets mode: 'js'.